
What the Mandelbrot set is
Take a complex number — a point on a flat plane. Start with , and repeat one rule over and over:
Square the number, add , and feed the result back in. For each point of the plane there are only two possible fates: either the sequence stays bounded forever, circling in the neighbourhood of the origin — or it escapes, growing without limit. The Mandelbrot set is the collection of every whose sequence stays bounded:
That's the whole definition. Nobody designed the shape; it was already there, waiting inside a one-line rule.
A worked orbit
The landing page iterated (bounded, period 2) and (escapes). Here is a subtler one, . Remember :
| how | ||
|---|---|---|
| 0 | start | |
| 1 | ||
| 2 | ||
| 3 | ||
| 4 | ||
| 5 | … and forever after |
After one step of wandering, the orbit falls into the two-beat cycle . Bounded — so belongs to the set. (Points like this, whose orbit is eventually periodic without being periodic from the start, are called Misiurewicz points; they sit exactly on the boundary, where the filaments live.)
Why radius 2 settles everything
"Bounded forever" sounds untestable — forever is a long time. One small theorem makes it practical: once an orbit leaves the circle of radius 2, it never comes back.
Suppose and (both hold from the first moment the orbit leaves the circle, because every interesting has ). The reverse triangle inequality gives
The factor is bigger than and grows every step, so the orbit's size increases at least geometrically from then on — escape is guaranteed. That is why a renderer only ever needs to check : crossing the circle is the verdict. (In practice Mandala tests — no square root — and actually lets orbits run further out for smoother colours; the next chapter explains why.)
Reading the picture
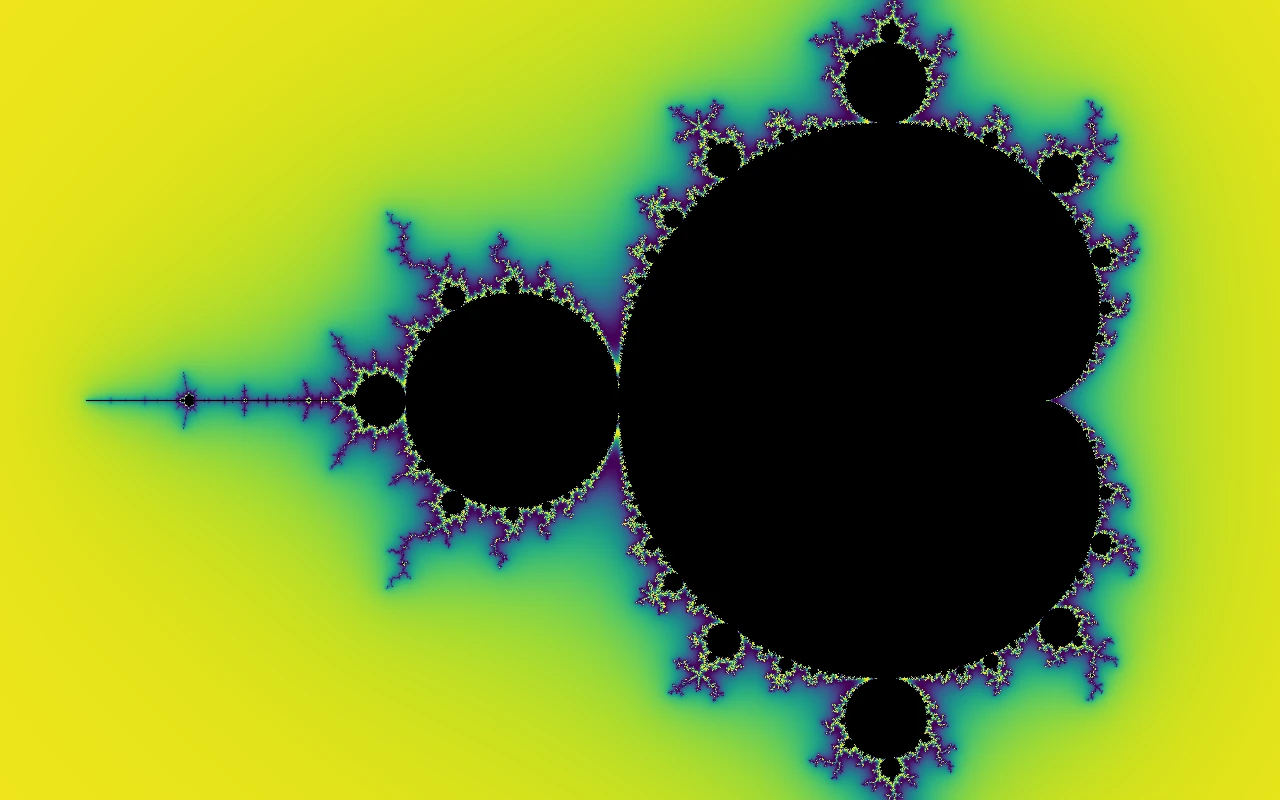
The solid black region is the set itself — the points that never escape. The shapes it is made of are not decoration; each one is a statement about how orbits settle.
The main cardioid is the set of whose orbit settles to a single resting value — a fixed point with . A fixed point attracts nearby orbits when the map's derivative there is small: . Write with ; solving the fixed point equation for gives
Sweep around the unit circle and this expression traces exactly the heart-shaped boundary you see — the cardioid is that formula made visible.
The period-2 bulb is the disk to the cardioid's west, where orbits end up bouncing between two values forever. The two values of such a cycle satisfy (divide the period-2 fixed-point equation of by the period-1 factor), so their product is . The cycle attracts when the two-step derivative is small: — that is, when
A perfect disk of radius centred at : exactly the bulb in the picture, derived in three lines.
Reading every bulb — the p/q rule
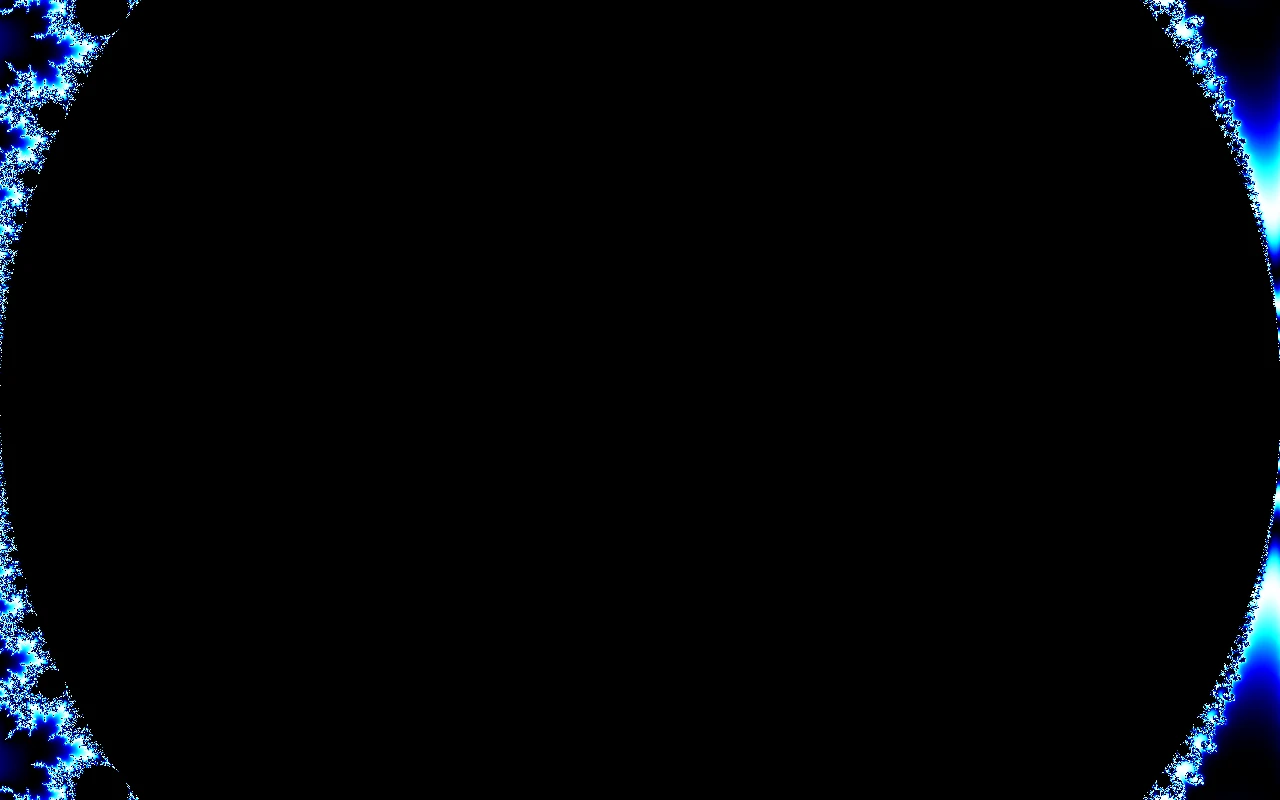
The same recipe organises all the smaller bulbs. Around the cardioid, a period- bulb is tangent at each internal angle — plug into the cardioid formula and you get the exact tangency point. And the picture announces its own arithmetic: the antenna sprouting from a bulb has exactly spokes, so you can count the period off the screenshot. The bulb straight up at the top of the cardioid () carries period 3; the next prominent one toward the cusp () carries period 4, and so on — a Farey sequence drawn in silhouette.
Westward along the real axis, the bulbs tell a different famous story: period 1 gives way to 2 at , to 4 at , then 8, 16, … — the period-doubling cascade — with the doublings crowding together and accumulating at the Feigenbaum point . Past it stretches the needle-thin antenna out to the tip at exactly , studded with miniature copies of the whole set.
The boundary between "stays" and "escapes" is where everything interesting lives. It is infinitely intricate: magnify any stretch of it and new spirals and filaments keep appearing at every scale, forever — and miniature copies of the whole set are never far away: small copies are provably dense along the boundary (a theorem from Douady–Hubbard renormalization), so zooming far enough on any boundary stretch always turns one up. The colours outside the set encode how fast each point escapes, which is the subject of the next chapter.
A short history
The set was first plotted by Robert Brooks and Peter Matelski in 1978, as a crude grid of asterisks on a line printer. Benoît Mandelbrot's computer experiments at IBM from 1980 revealed the structure hiding in it and gave the set its name — and helped found the study of fractals: shapes that are rough at every scale, the way coastlines, clouds and river networks are, rather than smooth the way circles are.
Everything in this guide can be checked by looking. Click any figure — it opens the exact same view, live, in the explorer.